")
")
")
The Curve window is, like the Animator, another option to animate Effect events.Examples for this are some of the effects from the Effects Window (double click to the timeline -> Effects Window -> More, e.g. CurveMove, CurveRotate, etc.) and also the begin / endcurve for the scan limit.
This curve describes the course of the Effect over time based on a start and end value, like in the Animator. The line in the window corresponds to these values. Minimum number of points is two though.
Where this curve is modified with functions like Sine, Cosine, Rectangle or external sources like DMX or MIDI in the Animator, it is possible to self draw this curve in the Curve Window.
This is an example from the Scanlimit Feature: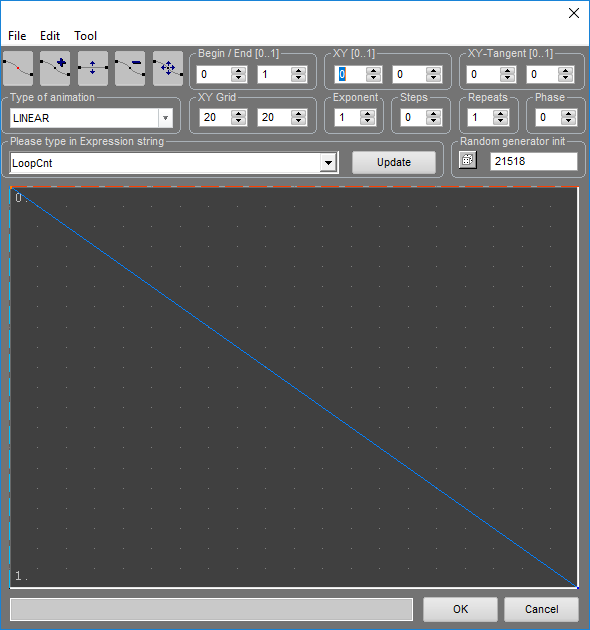
Startede with value "0"to the left, ending with value "1" to the right.
Use this tool ![]() to move the points, e.g. move the right point slightly up with pressed left mouse button:
to move the points, e.g. move the right point slightly up with pressed left mouse button: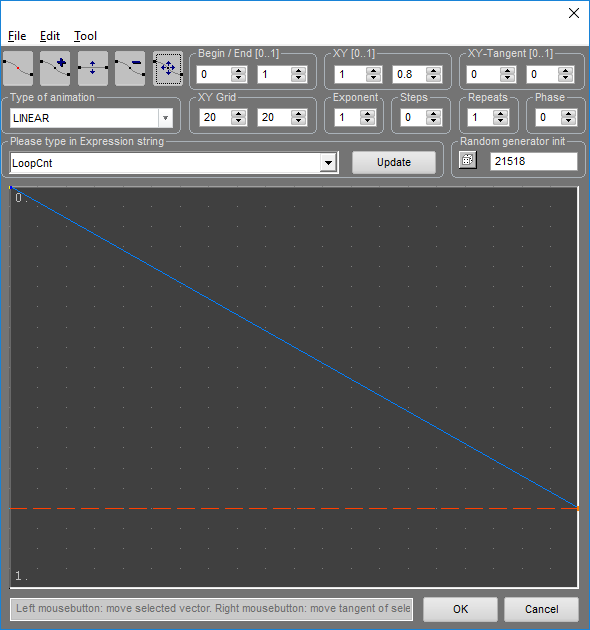
It is also possible to add points. Click on the "Add" tool ![]() and place the additional points at the desired position. Points automatically snap to the grid The grid size can be adjusted at "XY Grid".
and place the additional points at the desired position. Points automatically snap to the grid The grid size can be adjusted at "XY Grid".
Move the points to their positions afterwards, if necessary.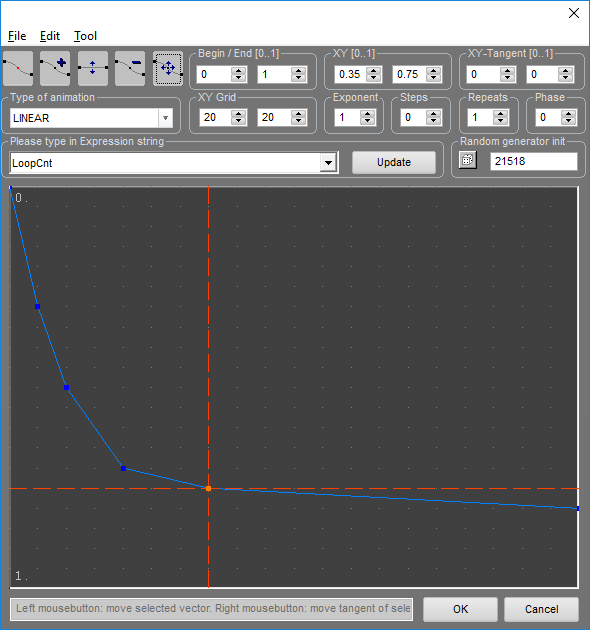
Above example would result in a significant change of the Effect in the first part and would only change slightly for the rest of the timeframe.
Custom created curves can be saved for later use at "File" -> "Save".
Select your language